Chest pain? Calculate your cardiovascular risk score.
The goal of RiskScorescvd R package is to calculate the most commonly used cardiovascular risk scores. Original research publication can be found here: https://openheart.bmj.com/content/11/2/e002755
We have developed nine of the most commonly used risk scores with a dependency (ASCVD [PooledCohort]) making the following available:
- HEART
- EDACS
- GRACE 2.0
- TIMI
- SCORE2/OP
- SCORE2-Diabetes
- SCORE2-CKD
- SCORE2-Asia
- PCE (ASCVD)
NOTE: Troponin I values should be used. Additional functions for Troponin T are under development
Installation
You can install from CRAN with:
# Install from CRAN
install.packages("RiskScorescvd")
You can install the development version of RiskScorescvd from GitHub with:
# install.packages("devtools")
devtools::install_github("dvicencio/RiskScorescvd")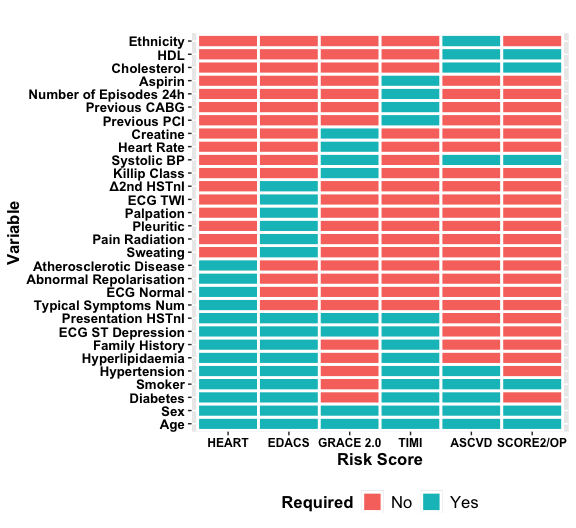
Example
This is a basic example of how the data set should look to calculate all risk scores available in the package:
library(RiskScorescvd)
#> Loading required package: PooledCohort
# Create a data frame or list with the necessary variables
 # Set the number of rows
 num_rows <- 100

 # Create a large dataset with 100 rows
  cohort_xx <- data.frame(
   typical_symptoms.num = as.numeric(sample(0:6, num_rows, replace = TRUE)),
   ecg.normal = as.numeric(sample(c(0, 1), num_rows, replace = TRUE)),
   abn.repolarisation = as.numeric(sample(c(0, 1), num_rows, replace = TRUE)),
   ecg.st.depression = as.numeric(sample(c(0, 1), num_rows, replace = TRUE)),
   Age = as.numeric(sample(30:80, num_rows, replace = TRUE)),
   diabetes = sample(c(1, 0), num_rows, replace = TRUE),
   smoker = sample(c(1, 0), num_rows, replace = TRUE),
   hypertension = sample(c(1, 0), num_rows, replace = TRUE),
   hyperlipidaemia = sample(c(1, 0), num_rows, replace = TRUE),
   family.history = sample(c(1, 0), num_rows, replace = TRUE),
   atherosclerotic.disease = sample(c(1, 0), num_rows, replace = TRUE),
   presentation_hstni = as.numeric(sample(10:100, num_rows, replace = TRUE)),
   Gender = sample(c("male", "female"), num_rows, replace = TRUE),
   sweating = as.numeric(sample(c(0, 1), num_rows, replace = TRUE)),
   pain.radiation = as.numeric(sample(c(0, 1), num_rows, replace = TRUE)),
   pleuritic = as.numeric(sample(c(0, 1), num_rows, replace = TRUE)),
   palpation = as.numeric(sample(c(0, 1), num_rows, replace = TRUE)),
   ecg.twi = as.numeric(sample(c(0, 1), num_rows, replace = TRUE)),
   second_hstni = as.numeric(sample(1:200, num_rows, replace = TRUE)),
   killip.class = as.numeric(sample(1:4, num_rows, replace = TRUE)),
   heart.rate = as.numeric(sample(0:300, num_rows, replace = TRUE)),
   systolic.bp = as.numeric(sample(40:300, num_rows, replace = TRUE)),
   aspirin = as.numeric(sample(c(0, 1), num_rows, replace = TRUE)),
   creat = as.numeric(sample(0:4, num_rows, replace = TRUE)),
   number.of.episodes.24h = as.numeric(sample(0:20, num_rows, replace = TRUE)),
   previous.pci = as.numeric(sample(c(0, 1), num_rows, replace = TRUE)),
   cardiac.arrest = as.numeric(sample(c(0, 1), num_rows, replace = TRUE)),
   previous.cabg = as.numeric(sample(c(0, 1), num_rows, replace = TRUE)),
   total.chol = as.numeric(sample(5:100, num_rows, replace = TRUE)),
   total.hdl = as.numeric(sample(2:5, num_rows, replace = TRUE)),
   Ethnicity = sample(c("white", "black", "asian", "other"), num_rows, replace = TRUE),
   eGFR = as.numeric(sample(15:120, num_rows, replace = TRUE)),
   ACR = as.numeric(sample(5:1500, num_rows, replace = TRUE)),
   trace = sample(c("trace", "1+", "2+", "3+", "4+"), num_rows, replace = TRUE)
 )

  str(cohort_xx)
#> 'data.frame':    100 obs. of  34 variables:
#>  $ typical_symptoms.num   : num  1 1 0 2 4 6 6 2 4 4 ...
#>  $ ecg.normal             : num  0 1 1 0 0 0 0 1 1 0 ...
#>  $ abn.repolarisation     : num  1 0 1 1 0 0 0 1 0 1 ...
#>  $ ecg.st.depression      : num  0 1 0 1 1 0 1 0 1 0 ...
#>  $ Age                    : num  61 75 60 44 47 46 71 39 56 50 ...
#>  $ diabetes               : num  1 1 1 1 0 1 0 0 1 1 ...
#>  $ smoker                 : num  0 1 0 1 0 0 1 1 1 1 ...
#>  $ hypertension           : num  1 1 1 1 1 0 1 0 0 0 ...
#>  $ hyperlipidaemia        : num  1 0 1 0 1 0 0 1 1 0 ...
#>  $ family.history         : num  1 0 0 0 1 1 0 1 0 1 ...
#>  $ atherosclerotic.disease: num  1 1 1 0 1 0 0 1 1 0 ...
#>  $ presentation_hstni     : num  19 75 96 76 82 35 36 20 54 27 ...
#>  $ Gender                 : chr  "male" "female" "male" "female" ...
#>  $ sweating               : num  1 0 0 1 1 0 1 0 1 0 ...
#>  $ pain.radiation         : num  1 1 1 1 1 1 1 1 0 1 ...
#>  $ pleuritic              : num  1 1 0 0 0 1 1 1 0 0 ...
#>  $ palpation              : num  1 0 1 0 0 0 0 0 0 1 ...
#>  $ ecg.twi                : num  0 1 1 0 0 1 1 0 0 1 ...
#>  $ second_hstni           : num  157 131 58 45 174 23 178 189 20 78 ...
#>  $ killip.class           : num  3 4 4 3 2 3 2 2 1 4 ...
#>  $ heart.rate             : num  227 273 122 169 147 291 267 266 198 148 ...
#>  $ systolic.bp            : num  41 218 153 118 282 92 191 293 101 267 ...
#>  $ aspirin                : num  1 0 0 1 0 0 1 0 1 1 ...
#>  $ creat                  : num  3 3 2 3 3 0 1 2 4 3 ...
#>  $ number.of.episodes.24h : num  11 12 19 18 12 17 10 16 4 8 ...
#>  $ previous.pci           : num  0 0 0 1 0 1 0 1 1 0 ...
#>  $ cardiac.arrest         : num  0 1 0 0 1 1 0 0 1 1 ...
#>  $ previous.cabg          : num  0 1 1 0 0 0 0 1 0 0 ...
#>  $ total.chol             : num  97 89 52 93 29 56 58 99 91 40 ...
#>  $ total.hdl              : num  3 3 4 3 4 5 5 4 5 2 ...
#>  $ Ethnicity              : chr  "other" "white" "white" "white" ...
#>  $ eGFR                   : num  77 69 110 81 22 76 68 58 43 65 ...
#>  $ ACR                    : num  782 1161 1005 595 840 ...
#>  $ trace                  : chr  "trace" "4+" "4+" "trace" ...
Calculation and Results
This is a basic example of how to calculate all risk scores available in the package and create a new data set with 12 new variables of the calculated and classified risk scores:
# Call the function with the cohort_xx to calculate all risk scores available in the package
new_data_frame <- calc_scores(data = cohort_xx)

# Select columns created after calculation
All_scores <- new_data_frame %>% select(HEART_score, HEART_strat, EDACS_score, EDACS_strat, GRACE_score, GRACE_strat, TIMI_score, TIMI_strat, SCORE2_score, SCORE2_strat, ASCVD_score, ASCVD_strat)

# Observe the results
head(All_scores)
#> # A tibble: 6 × 12
#> # Rowwise:
#>   HEART_score HEART_strat   EDACS_score EDACS_strat  GRACE_score GRACE_strat
#>         <dbl> <ord>               <dbl> <ord>              <dbl> <ord>
#> 1           4 Moderate risk          14 Not low risk         150 High risk
#> 2           8 High risk              15 Not low risk         181 High risk
#> 3           5 Moderate risk          13 Not low risk         132 High risk
#> 4           7 High risk              14 Not low risk         131 High risk
#> 5           8 High risk              16 Not low risk          88 Low risk
#> 6           6 Moderate risk           5 Not low risk         132 High risk
#> # ℹ 6 more variables: TIMI_score <dbl>, TIMI_strat <ord>, SCORE2_score <dbl>,
#> #   SCORE2_strat <ord>, ASCVD_score <dbl>, ASCVD_strat <ord>

# Create a summary of them to obtain an initial idea of distribution
summary(All_scores)
#>   HEART_score           HEART_strat  EDACS_score          EDACS_strat
#>  Min.   : 2.00   Low risk     : 6   Min.   :-2.00   Low risk    : 1
#>  1st Qu.: 5.00   Moderate risk:54   1st Qu.: 5.00   Not low risk:99
#>  Median : 6.00   High risk    :40   Median :10.00
#>  Mean   : 6.06                      Mean   :10.78
#>  3rd Qu.: 7.00                      3rd Qu.:16.00
#>  Max.   :10.00                      Max.   :30.00
#>   GRACE_score            GRACE_strat   TIMI_score           TIMI_strat
#>  Min.   : 29.00   Low risk     :30   Min.   :2.00   Very low risk: 0
#>  1st Qu.: 85.75   Moderate risk:34   1st Qu.:4.00   Low risk     : 6
#>  Median :107.00   High risk    :36   Median :4.00   Moderate risk:49
#>  Mean   :108.53                      Mean   :4.44   High risk    :45
#>  3rd Qu.:132.00                      3rd Qu.:5.00
#>  Max.   :205.00                      Max.   :7.00
#>   SCORE2_score           SCORE2_strat  ASCVD_score            ASCVD_strat
#>  Min.   :  0.00   Very low risk: 0    Min.   :0.0000   Very low risk: 7
#>  1st Qu.: 55.00   Low risk     : 6    1st Qu.:0.1900   Low risk     : 2
#>  Median :100.00   Moderate risk: 6    Median :0.4650   Moderate risk:17
#>  Mean   : 75.87   High risk    :88    Mean   :0.5027   High risk    :74
#>  3rd Qu.:100.00                       3rd Qu.:0.8300
#>  Max.   :100.00                       Max.   :1.0000